
Greek shipping and economy 2019
The Strategic and Economic Role of Greek Shipping
The global economy started in 2018 on a positive note but, as industrial production decelerated, trade slowed and business confidence fell, the momentum lost steam. Global growth, which peaked at close to 4% in 2017, moderated to 3.6% in 2018 and is projected to decline further to 3.3% in 2019. With improvements expected in the second half of 2019, global economic growth in 2020 is projected to return to 3.6%.
Global trade growth decreased over the course of 2018 in volume terms, from 5.3% in 2017 to 3.8%1. One reason behind this loss of momentum is the rise in global trade tensions. Some 27 cases were brought to the World Trade Organization (WTO) Dispute Settlement Mechanism (DSM), while the total number of active trade disputes has steadily been increasing in recent years2. Tensions are exacerbated by the implementation of tariffs by major economies - especially the United States (U.S.) of America - and retaliatory measures taken by others, including China. The increasingly protectionist rhetoric on trade has meant higher uncertainty about trade policy, which weighs on future investment decisions. Concerns over escalation and retaliation could lower business investment, disrupt supply chains and slow productivity growth.
Global seaborne trade is estimated to have grown at a steady 4% rate in 20183 (Figure 1). Growth prospects have been downgraded to 3% over the 2018-2020 period, while the growth rate of global merchandise trade volumes is set to decrease from 3.9% in 2018 to 3.7% in 20194. Contingent on continued economic conditions in the global economy, activity in all segments of the shipping industry will continue to be marked by uncertainty, despite more positive projections for liquid and dry bulk commodity trades.
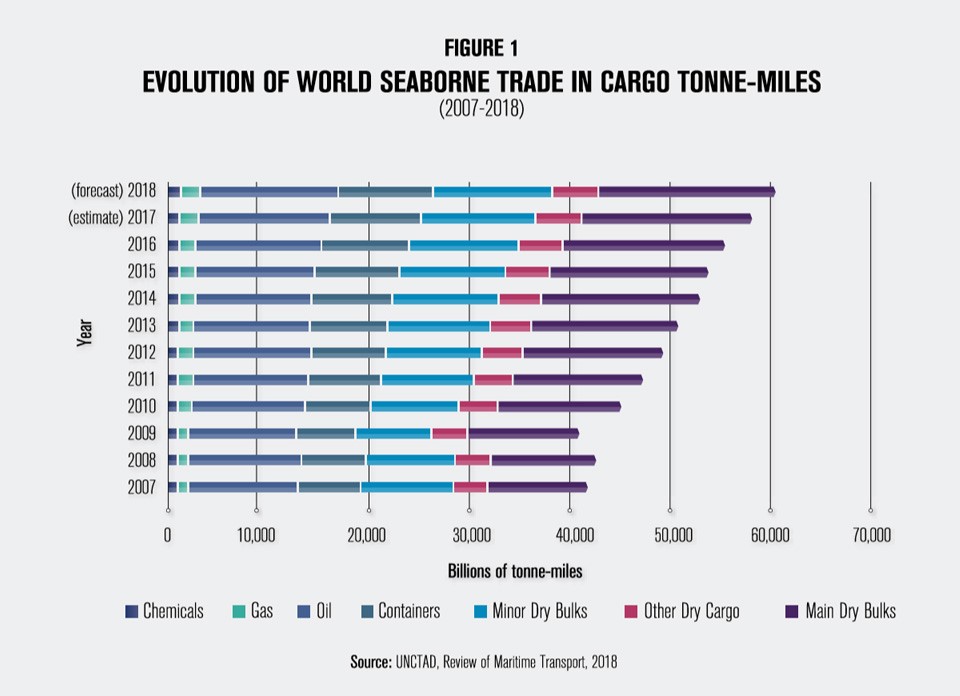
Global fleet growth in 2018 is estimated at about 1.5% compared to 20175. While dry bulk commodities are projected to experience a compound annual growth rate of 4.9% between 2018 and 2023, the decrease of Chinese seaborne imports represents a challenging situation for several segments of the industry. In the dry bulk market, the shifting interest of Chinese steel mills from imported iron ore towards scrap metal is a major turning point. The trade war between the U.S. and its main trading partners, mainly China, casts further uncertainty in the agri-bulks segment.
Despite an overall healthy global oil demand, 2018 has been a very difficult year for oil tankers, with crude-oil tanker operators being particularly affected. After three years of profits, freight rates and fleet utilisation rates fell to record low levels due to an excess in supply. The U.S. sanctions on Iran have contributed to the severity of the situation. Tanker trade volumes are projected to increase, although at a slightly slower pace6. For the tanker market to truly improve however, a lot will depend on demolition activity in 2019.
In the container market, after two busy years, demolition activity fell abruptly in 2018 hitting a 10-year low, causing fleet growth to exceed demand. The continued inflow of very large containerships in the Far East to Europe trade lane pushed freight rates down7. This gloomier economic outlook is compounded by rising protectionism, which adds another level of unpredictability to the container market.
In 2018, Greece exited its European Stability Mechanism programme and some limited economic growth took hold, though significant vulnerabilities remain. Exports in 2018 grew by 15.7% to €33,417.9 million8. Industrial production picked up between 2015-2017, reaching a 4.5% growth rate in 2017 but slowed down again to 1% in 20189. Confidence indicators have somewhat improved, with wages rising and private consumption slowly growing after prolonged stagnation. Nevertheless, unemployment and spare capacity remain high. The Gross Domestic Product (GDP) for 2018 in volume terms amounted to €190.8 billion compared with €187.2 billion for 2017, recording an increase of 1.9%10. Real GDP growth is forecast to reach 2.2% in 2019 and in 202011.
Despite an economic landscape offering few investment incentives, the receipts in the Services Balance of Payments from maritime transport are estimated at approximately €16,629 million for 201812. That is 14.89% more in relation to 2017 when the receipts were €14,473 (Figure 2).
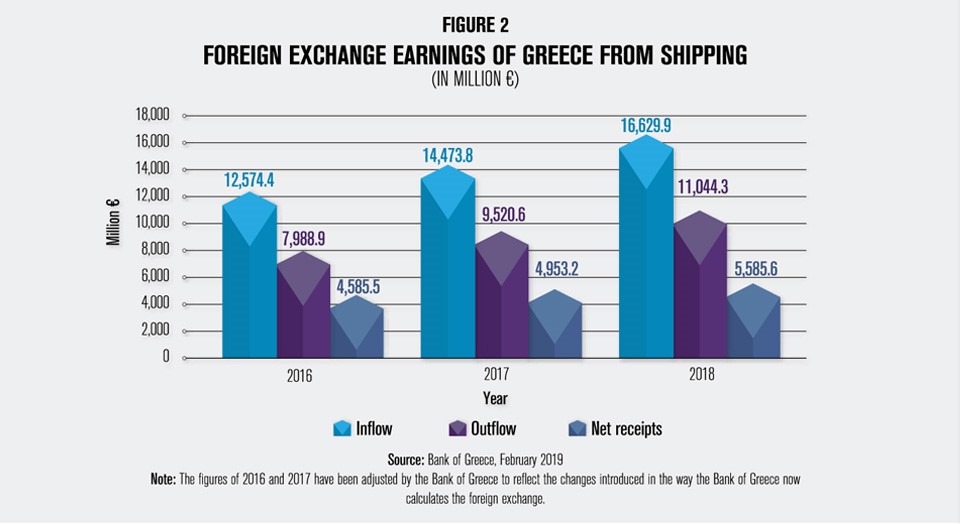
The contribution of Greek shipping to the country is as important as it is diverse, going beyond the receipts in the Services Balance of Payments from maritime transport services. It ranges from indirect economic investments, to employment opportunities and to raising the profile of the country internationally by being an essential and strategic trade partner of major economic and political forces, with 22.5% and 20.3% of the Greek-owned fleet’s activity being dedicated to the U.S. and the European trade respectively and with the greatest share of the Greek-owned fleet’s activity, i.e. 31.8%, taking place in Asia serving the fast growing Asian economies13.
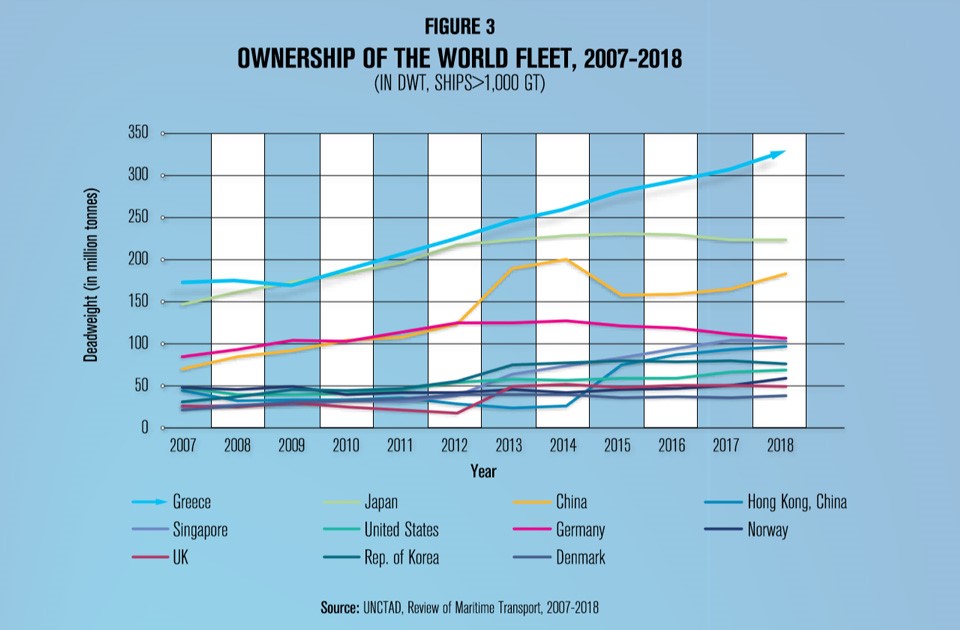
The numbers are indeed impressive; while Greece represents only 0.15% of the world population, Greek-owned ships represent almost 21% of the global tonnage. The Greek merchant fleet is the biggest fleet in the world, with 4,936 vessels (ships over 1,000 gt) of 389.69 million deadweight tonnes (dwt) - an increase of approximately 6.63% from the previous year. Greek shipowners more than doubled the carrying capacity of their fleet between 2007 and 2018 (Figure 3). The Greek-owned fleet represents 53% of the European Union (EU) fleet in dwt14 (Figure 4) and 20.9% of the world fleet in dwt15.
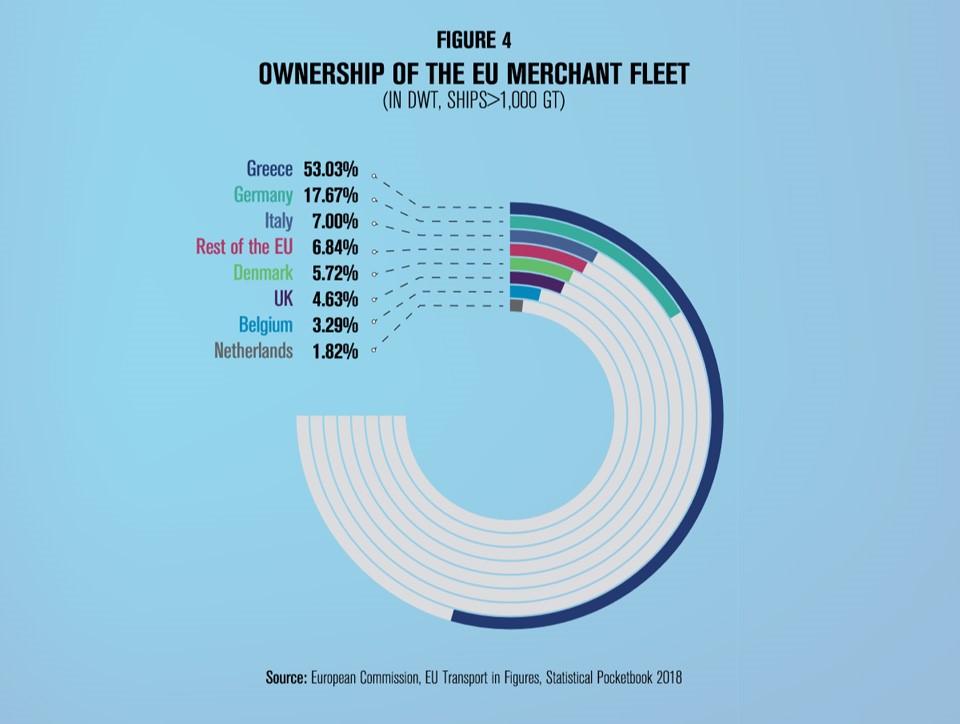
As such, Greek shipping’s strategic role in serving global trade and especially in securing the extra-EU trade, including its energy supplies, is clearly manifested. More specifically, the EU imports 87% of its crude oil needs, 70% of its natural gas needs and 40% of its solid fossil fuels needs. With the energy security concerns on the rise, the Greek-owned fleet plays a crucial role in securing EU’s diverse energy imports from remote regions of the world. Greek shipping’s strategic importance becomes also obvious in light of the fact that the EU relies on international shipping for more than 75.5% of its external trade16.
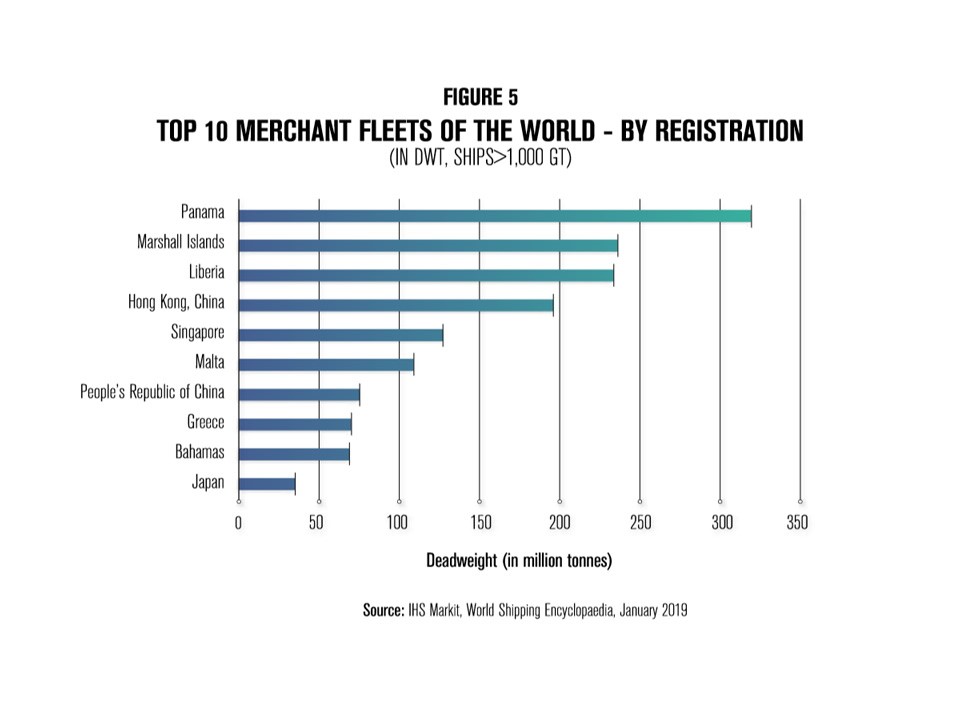
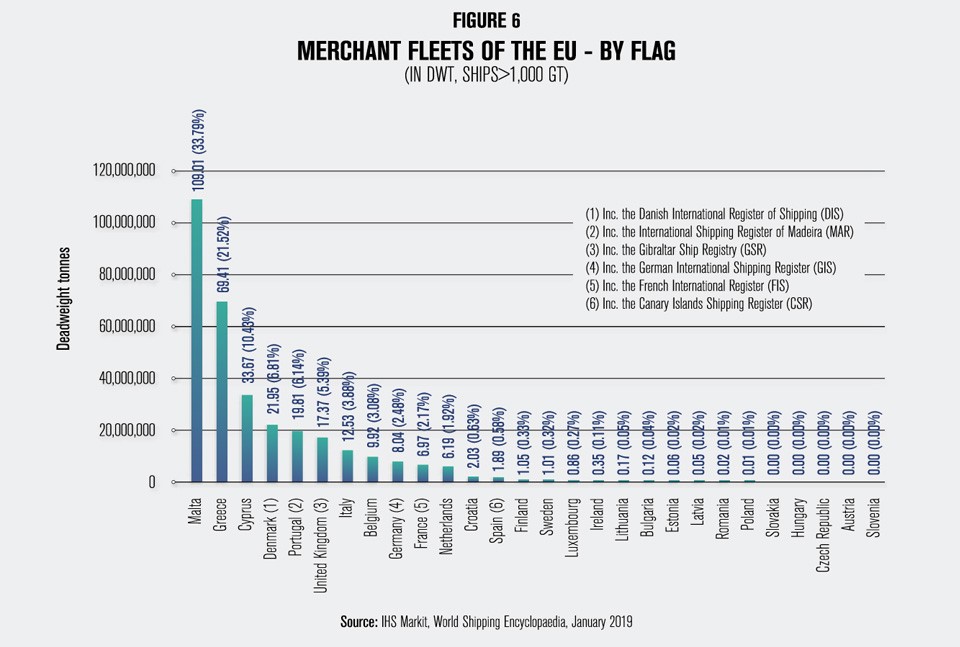
The Greek Register accounts for 720 vessels (over 1,000 gt) amounting to 39.61 million gt. The Greek-flagged fleet ranks 8th internationally (Figure 5) and second in the EU (in terms of dwt) (Figure 6). Moreover, Greek shipowners control 31.99% of the world’s crude oil tankers fleet, 23.12% of the world dry bulk carriers fleet and 15.17% of the world chemical and products tankers fleet (Figure 7)17.

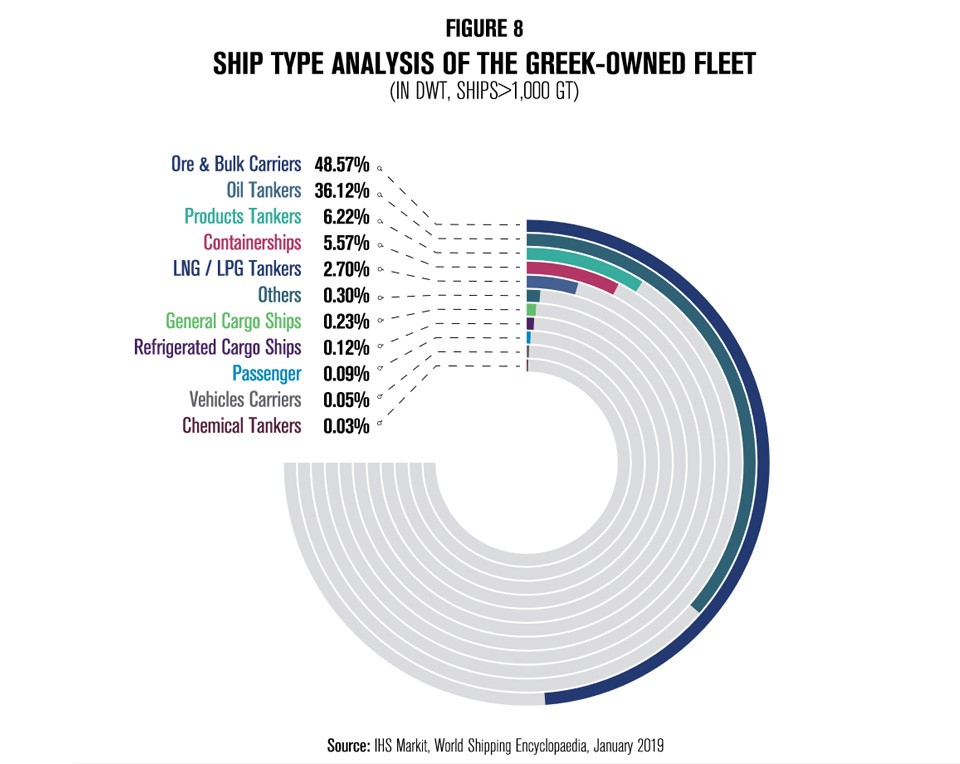
Greek shipping is primarily involved in bulk / tramp shipping (Figure 8), which is an example of a sector with characteristics of perfect competition. Being served by entrepreneurs who mainly own small and medium-sized private companies, mostly family businesses, Greek shipping has great flexibility and adaptability to changing economic environments and can, thus, readily respond to changing trade patterns and flows effectively and efficiently.
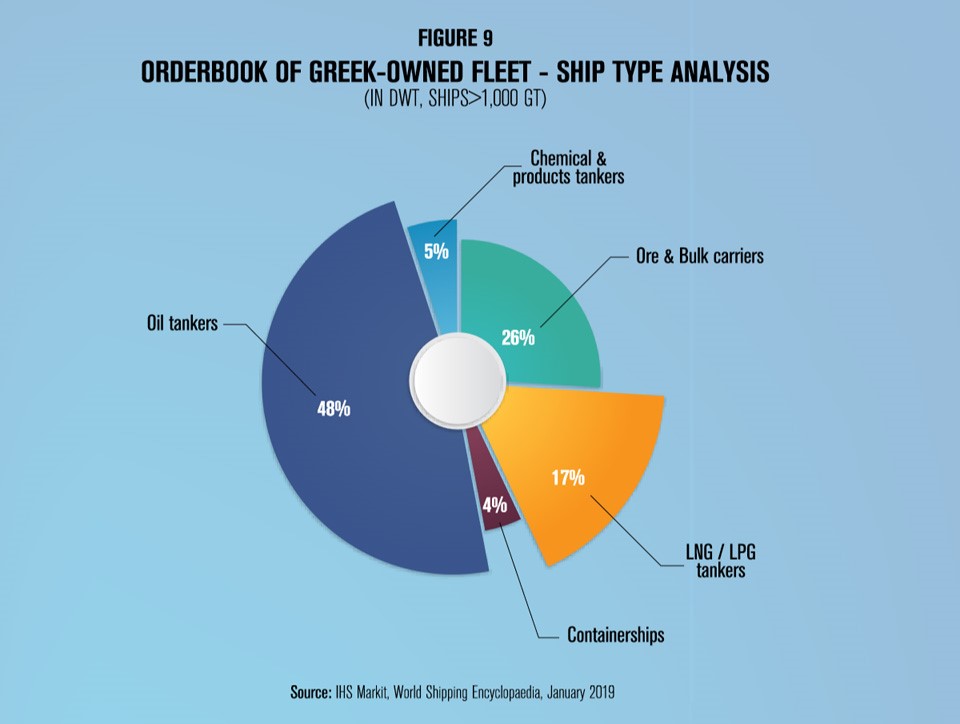
Newbuilding orders by Greek interests amounted to 223 vessels (over 1,000 gt), representing 25.03 million dwt of diverse ship types (Figure 9) from a total of 2,578 orders of 189.78 million dwt at the beginning of 201918.
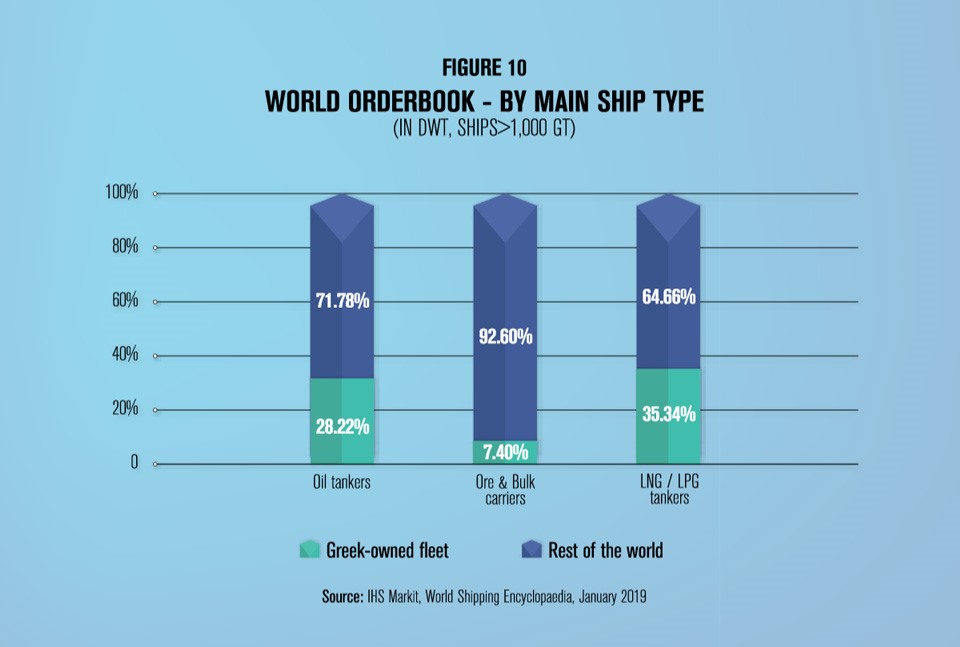
Of these vessels, 139 are tankers corresponding to 31.86% of tankers world tonnage (dwt) on order, which include 51 LNG / LPG tankers amounting to 35.34% of world tonnage (dwt) on order of this type, as well as 26 chemical / products tankers corresponding to 10.72% of world tonnage (dwt) on order. The Greek orderbook also includes 71 dry bulk carriers corresponding to 7.40% of world tonnage (dwt) on order and 13 containerships corresponding to 3.24% of world tonnage (dwt) on order (Figure 10). Greek shipowners scrapped 36 ships totalling 2,276,131 dwt or 10.12% of global demolition activity in terms of dwt19.
The average age of the Greek-flagged fleet is 14.33 years and that of the Greek-owned fleet 11.74 years, whilst the average age of the world fleet is 15.2 years20. Greece remains on the UN IMO “List of confirmed Standards of Training, Certification and Watchkeeping for Seafarers (STCW) Parties” and on the White Lists of the Paris and the Tokyo Memorandum of Understanding, while it is one of the safest fleets worldwide with 0.43% of the fleet and 0.11% of total tonnage being involved in minor accidents21.
The prospects for 2019 look relatively healthy. Both global GDP and global trade are expected to grow, albeit at a slower pace than 2018. World seaborne trade is projected to expand at a compound annual growth rate of 3.8% between 2018 and 2023. The extensive demolition activity seen in 2018 will most probably not be repeated in 2019. However, trade disputes and shipping-related regulatory trends will continue to feed uncertainty in the shipping market. Other geopolitical developments will also affect the shipping market’s outlook for the years to come: Brexit stands to disrupt seaborne trade flows in Northern Europe while, as China moves up the global value chain, transforming from the world’s factory to a consumption country, new trading opportunities are opening up for other South-East Asian countries. This in turn is expected to shift global trade patterns.
Greek shipping is a major Greek and EU export industry
of strategic importance.
