

Greek shipping and economy 2017
he global shipping recession continued through 2016 with market conditions being as challenging as any seen in the last few decades across most sectors of the shipping industry. A stable average global economic growth at 3.1% for 2016 reflects divergent developments: political, economic and trade policy uncertainties in advanced economies (e.g. the Brexit shock, President’s Trump trade policy agenda) and diverse growth rates between emerging market and developing economies (broadly stable in Asian economies and India, weaker than expected in some Latin American countries currently in recession, such as Argentina and Brazil, and sharp slowdown in sub-Saharan Africa)1. However, in 2016 world merchandise trade decelerated even further both in absolute terms and in relation to overall economic growth. The growth rate in world trade volumes in 2016 was about 2.3% – lower than the average 3% per year since 2012 and less than half the average rate of expansion during the previous three decades. Much of this sluggish growth in trade is attributed to subdued investment spending across many developed countries – some still recovering from the global financial and European debt crises – as well as emerging market and developing economies – due to weak commodity prices bringing trade losses on commodity exporting countries limiting their capacity for capital spending. China’s rebalancing away from import-intensive investment and towards more consumption-led growth and other structural changes, like a slower development of global value chains and a rise in protectionist measures rather than globalization, are also contributory factors to this trade slowdown. It is notable that between 1985 and 2007, world trade grew on average twice as fast as global Gross Domestic Product (GDP), whereas over the past four years, it has barely kept pace2.
The Greek fleet has a strategic role in the transportation of the trade and energy of many regions in the world and of the EU, which relies on international shipping for 75% of its external trade.
Against shrinking trade activity, global seaborne trade growth in 2016 was about 2.6%. Global fleet growth was estimated at about 3%, its slowest rate of expansion since 2003, with firm demolition – especially in containerships with an average demolition age of 18 years – counterbalancing steady delivery volumes. The European Union (EU) owned and EU operated fleet exhibited significantly lower growth rates than those of its competitors in, for instance, Asia3. Vessel earnings in most shipping sectors were under pressure with the two milestones of 2016 being the Baltic Dry Index falling to an all-time low of 290 in February and the collapse of Hanjin Shipping in the containership sector, the first major corporate casualty for 30 years. The charter market of oil tankers witnessed also a fall in 2016, from a healthy previous year, mostly due to a negative imbalance of fleet and trade growth, while container trades continued to be beset by the gloom of the end of the previous year, bringing on further consolidation of the sector. With vessel earnings at bottom of the cycle levels for most shipping sectors, ordering of new-build capacity was brought to a halt. 2016 marked an overall 71% drop in ordering with contracting activity falling to its lowest level in over 30 years in both numerical and tonnage terms, with the exception of cruise and passenger ferry ordering. In contrast, shipowners showed Sale and Purchase (S&P) interest in bottoming out sectors like the dry bulk carrier market where a 24% increase in the activity in the S&P market was noted.
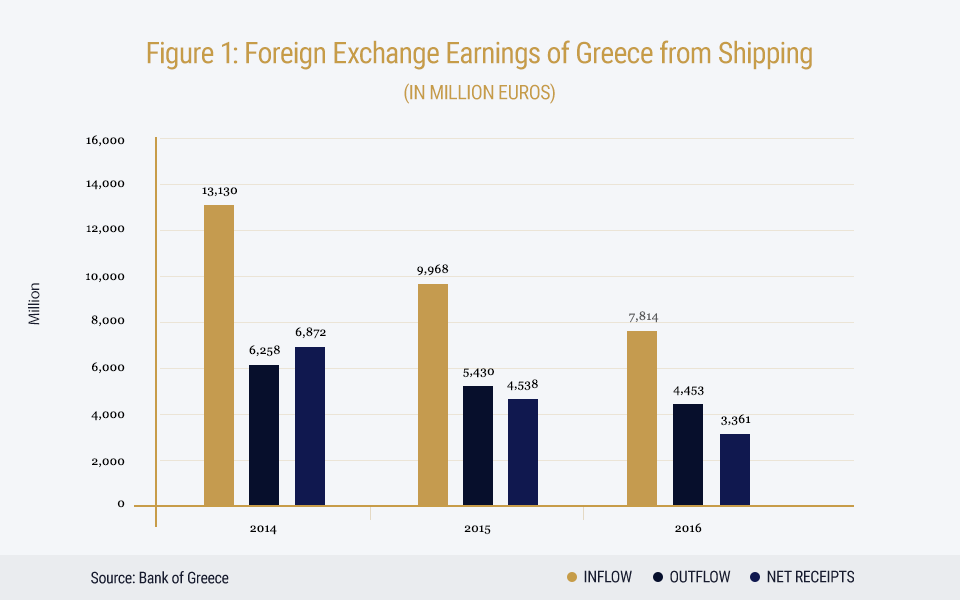
2016 was another tough year for both the Greek economy and Greek shipping. Delays in notable improvements in the economic fundamentals of Greece coupled with a prevailing economic uncertainty effected a gloomy environment for investments in the country. The capital controls have had a disastrous impact on the foreign exchange account balance and especially the foreign exchange earnings from shipping since July 2015 when they were first imposed. The first half of 2016, receipts in the Services Balance of Payments4 that come from maritime transport services were €3.60 billion, a decrease of 42.42%, compared to the same period in 2015, which was €6.42 billion. The Greek shipping industry, which was never part of the debt crisis of the Greek state, experienced substantial disruptions to its daily operations due to the restrictions on capital movements. Consequently, a significant number of shipping enterprises has been forced to redirect vessels’ earnings abroad in order to fulfil promptly and effectively their international financial responsibilities. On a positive note, in the period July - December 2016 foreign currency inflow from maritime services reached €4.22 billion, an increase of almost 20% compared to the same period in 2015 which was €3.54 billion. In total, the foreign currency inflow from shipping in 2016 was €7.81 billion, a decrease of 22% compared to the same period in 2015 which was €9.97 billion (Figure 1). In fact the foreign currency inflow from maritime services in the last two years (2015-2016) was reduced by 29.4% in comparison to the years 2013-2014 owing to the effect of the capital controls.
Yet despite such negative developments shipping remains one of the two stalwarts of the Greek economy as, over decades, it has consistently contributed to the Greek economy in more than one ways while at the same time raising the profile of Greece internationally. The receipts in the Services Balance of Payments from maritime transport services are estimated at approximately €136 billion for the years 2007-2016. That is 16% more than the other important Greek economic sector, tourism, which has contributed around €117 billion over the same decade. The industry employs around 200,000 people5, while the Union of Greek Shipowners (UGS) has repeatedly underlined the potential of the industry to provide further employment opportunities to Greek nationals for a career at sea within an internationally competitive framework.
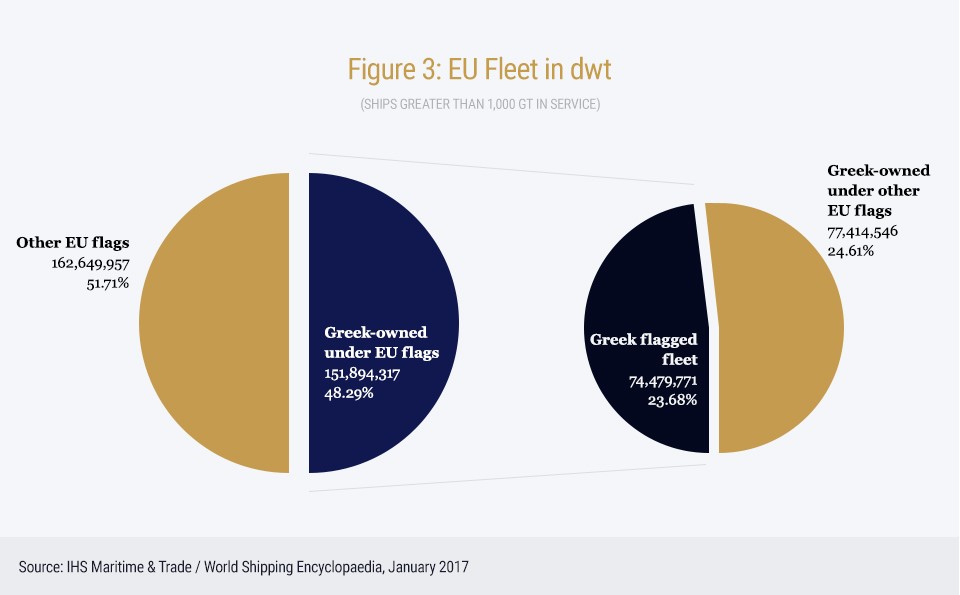
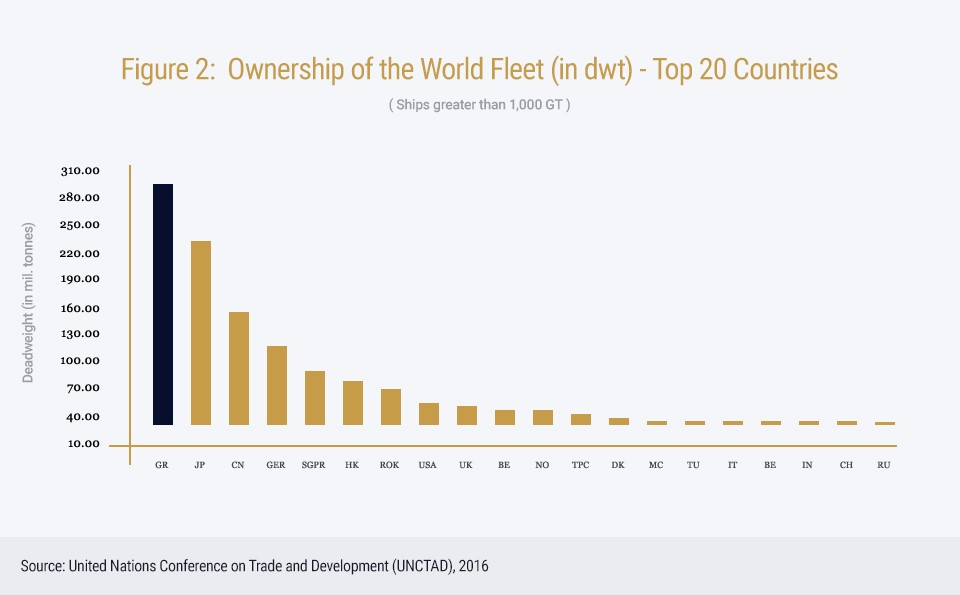
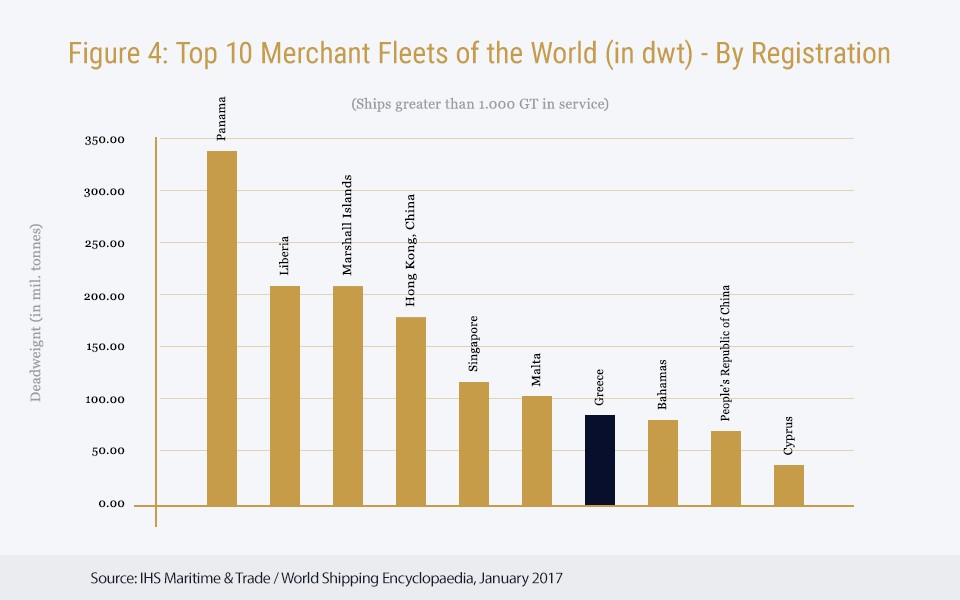
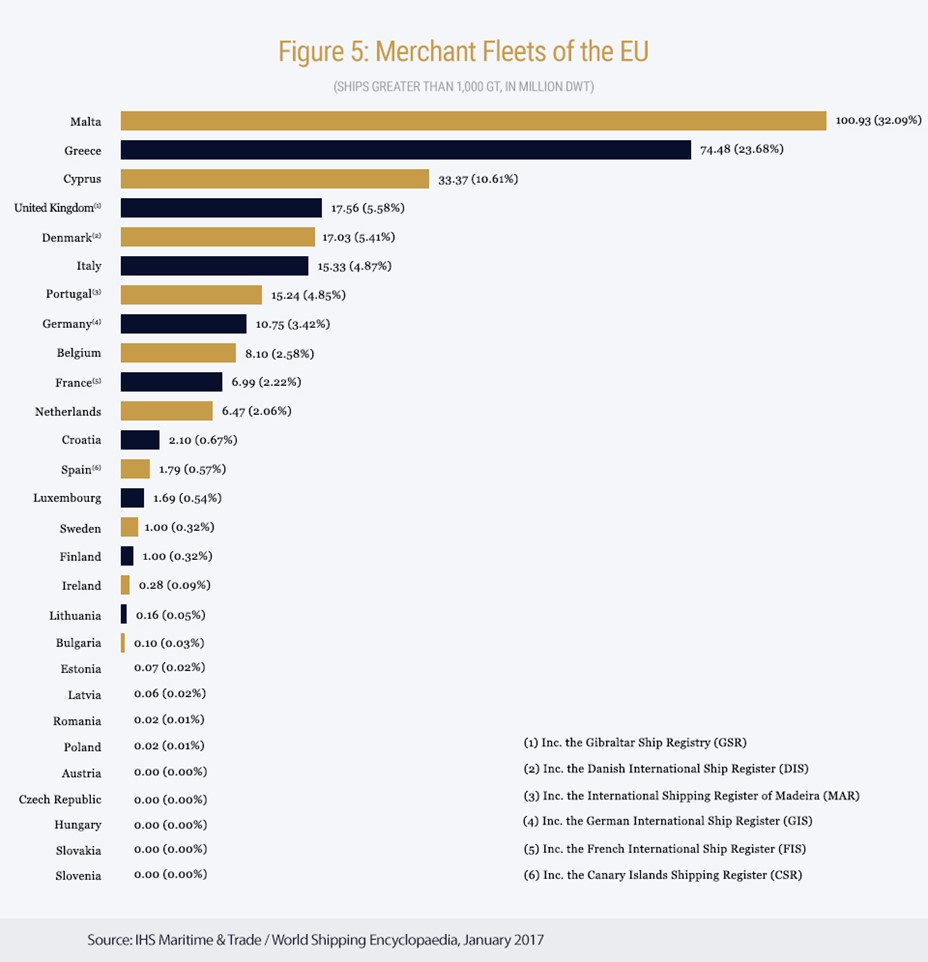
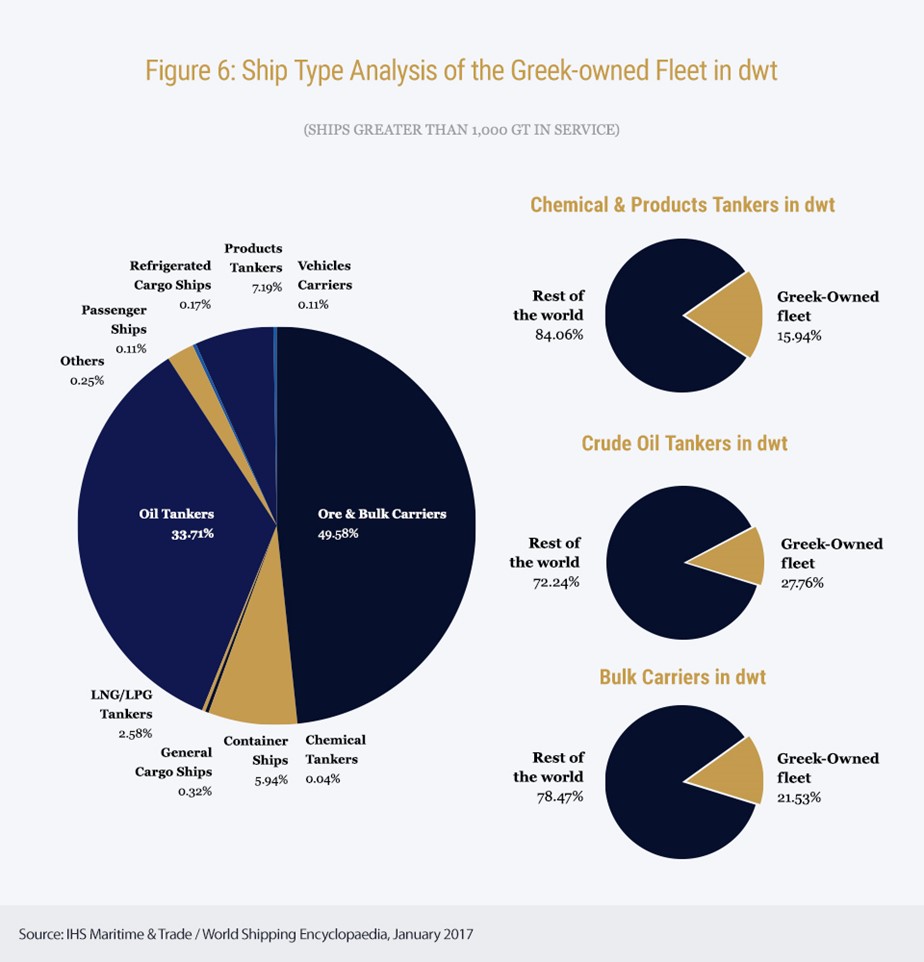
In the face of the aforementioned adverse global and domestic economic conditions, Greek shipping once again showed resilience retaining the first position internationally (Figure 2). The fleet amounts to 4,585 vessels (ships over 1,000 gt) of 342.75 million deadweight tons (dwt) – an increase of approximately 0.5% from the previous year - representing 19.19% of total world dwt and 48.29% of the total EU fleet6 (Figure 3). In 2016, the Greek Register accounted for 759 vessels (over 1,000 gt) amounting to 42.38 million gt7. The Greek flagged fleet ranks seventh internationally (Figure 4) and second in the EU (in terms of dwt) (Figure 5). Moreover, Greek owners control 27.76% of the world crude oil tanker fleet, 21.53% of the world dry bulk carrier fleet and 15.94% of the world chemical and products tanker fleet (Figure 6).
Shipping has consistently contributed to the Greek economy in more than one ways while at the same time, raising the profile of Greece internationally.
Against shrinking ship finance and depressed freight markets, newbuilding orders by Greek interests amounted to 288 vessels (over 1,000 gt), representing 29.06 million dwt from a total of 2,717 orders of 192.66 million dwt8 placed for newbuildings by the end of 2016. Of these vessels, 187 were tankers corresponding to 25.33% of world tonnage (dwt) on order, which include 49 LNG / LPG tankers amounting to 19.21% of world tonnage (dwt) on order, 77 dry bulk carriers corresponding to 9.44% of world tonnage (dwt) on order and 22 containerships corresponding to 5.13% of world tonnage (dwt) on order.
The age profile of the Greek flagged fleet in 2016 was 13.2 years and of the Greek-owned fleet 11.3 years, whilst the average age of the world fleet was 14.6 years9. Greece remains on the Standards of Training, Certification and Watchkeeping International Convention for Seafarers (STCW) White List of the International Maritime Organization (IMO) and the Greek flag is included in the Paris Memorandum of Understanding (Paris MOU) White List, while it is one of the safest fleets worldwide with only 0.76% of the fleet (based on number of ships) or 0.16% of the fleet (based on tonnage) involved in minor accidents in 201610.
Although the road to a full recovery is expected to be long and trying, there are signs that some improvement is likely for 2017, mainly due to a gradually narrowing of the gap between supply and demand. Global growth is projected to be 3.4% in 2017 with expected increased economic activity in emerging market and developing economies11 and expanded seaborne trade volumes, while there are also positive developments to the supply side fundamentals with high levels of demolition – also in view of upcoming regulatory requirements – beginning to have a sizeable impact. Indeed, positive developments in the freight rate market have already been noted with the Baltic Dry Index recording in March 2017 a 29% increase from the start of the year, representing a 324% increase from its record low in February 2016. Any recovery, however, will remain fragile subject to a number of factors: the volatility of the geopolitical environment, potential trade disruptions and obstruction of trade lanes due to regional power, rising protectionism and risk of consequent trade wars, rising regionalism, especially with regard to environmental issues and risk of adoption of unrealistic and ineffective regulations, contracting bank financing and increased cost of lending.
In light of the above, the Greek shipping community, which comprises mainly small and medium-sized private companies and embodies the true spirit of entrepreneurship, firmly supports the existence of free trade and access to markets and of an efficient international regime for a vital international industry, such as shipping. Representing the biggest cross- trading fleet in the world, the Greek fleet has a strategic role in the transportation of the trade and energy of many regions in the world, and of the EU, which relies on international shipping for 75% of its external trade12 and of which it is an integral part.
Regarding the impact of the Greek shipping industry on the Greek economy see also below:
Information regarding the economic value of the EU shipping industry can be found in the “Oxford Economics study on the economic value of the EU shipping industry”, 2014, 2015, 2017, at ECSA site: http://www.ecsa.eu/publications
Information regarding the EU shipping competitiveness can be found in Monitor Deloitte’s “EU Shipping Competitiveness Study”, at ECSA site: http://www.ecsa.eu/publications