

Greek shipping and economy 2018
In 2017 the first rays of improved market conditions for global shipping made their appearance after a long and deep recession and challenging fundamentals for 2016 across most sectors.
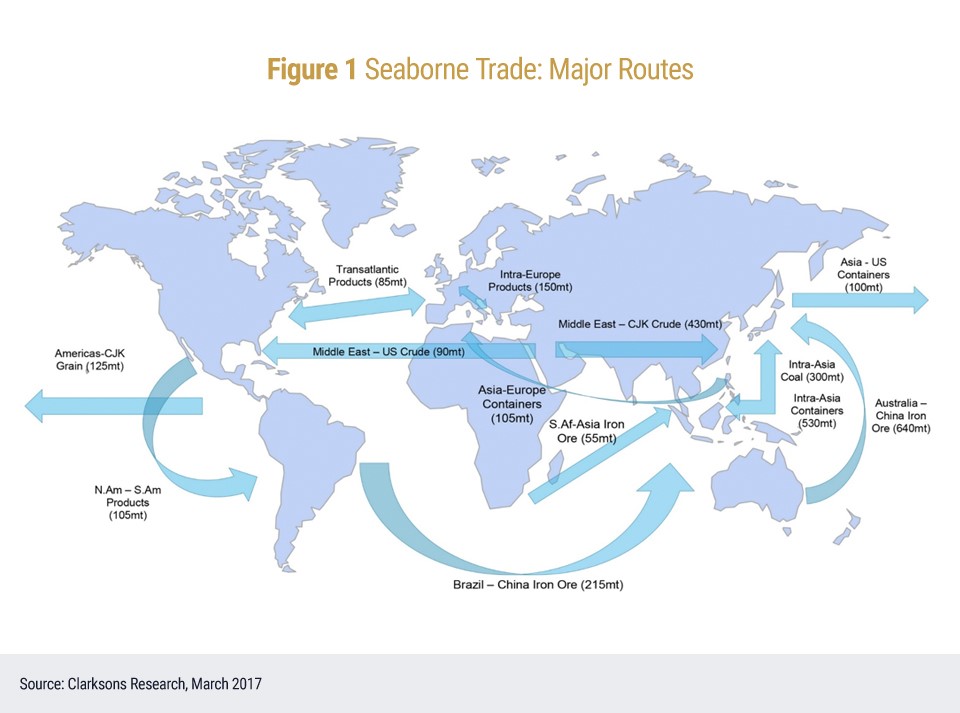
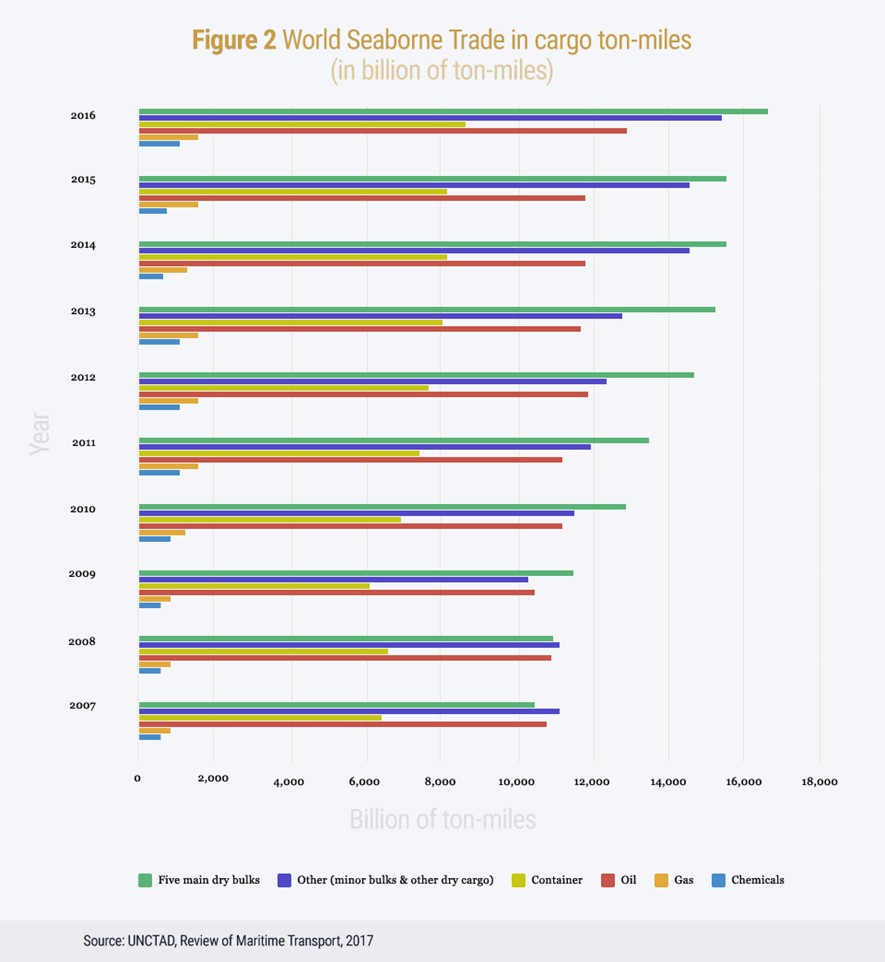
The global upswing underway since mid-2016 continued to strengthen through 2017 bringing about a broad-based annual global economic growth of 3.7%1. World trade also grew, by 4.7%, leaving behind the slowest pace since 2009 it had witnessed the previous year. In 2017 global trade was clearly supported by a pickup in investment, particularly among advanced economies, and increased industrial production in Asia, coupled with strengthening business and consumer confidence. Figure 1 shows the main trading routes of seaborne transport. The welcome cyclical upturn, after the disappointing growth over the past few years, provided an ideal window of opportunity for shipping markets to expand with a healthy increase in world seaborne trade volumes (Figure 2) of about 4%2 for 2017. Better market prospects were clearly visible for containerships and dry bulk carrier sectors, while uncertainties, especially in the tanker and gas markets, continued.
Global fleet growth was estimated at about 3.3%, and although it was marked by decreased demolition activity, it was still outpaced by trade growth. The balanced growth in world shipping demand and supply supported freight rates bringing about encouraging signs, despite contrasting realities across sectors, especially between the earnings of tankers and dry bulk carriers. The containership sector, overcoming the collapse of Hanjin Shipping the previous year and furthering its consolidation, started showing positive fundamentals and gradual improvement in rate levels. With contracting activity bottoming out in 2016, the close to 1,000 new orders placed in 2017 globally marked a marginal increase. The newbuilding market’s low level was matched by particularly increased second-hand sales volumes. Greek shipowners were very active in both markets. It is, however, important to note that the orders for newbuildings placed by Greek shipowners were essentially responsible for the 4.2% increase in the volume of European-owned tonnage in 2017, bringing the growth of the European-owned fleet slightly above the 3.8% growth rate of the Asia / Pacific-owned fleet, and enabling Europe to maintain its leading global position in shipowning terms3.
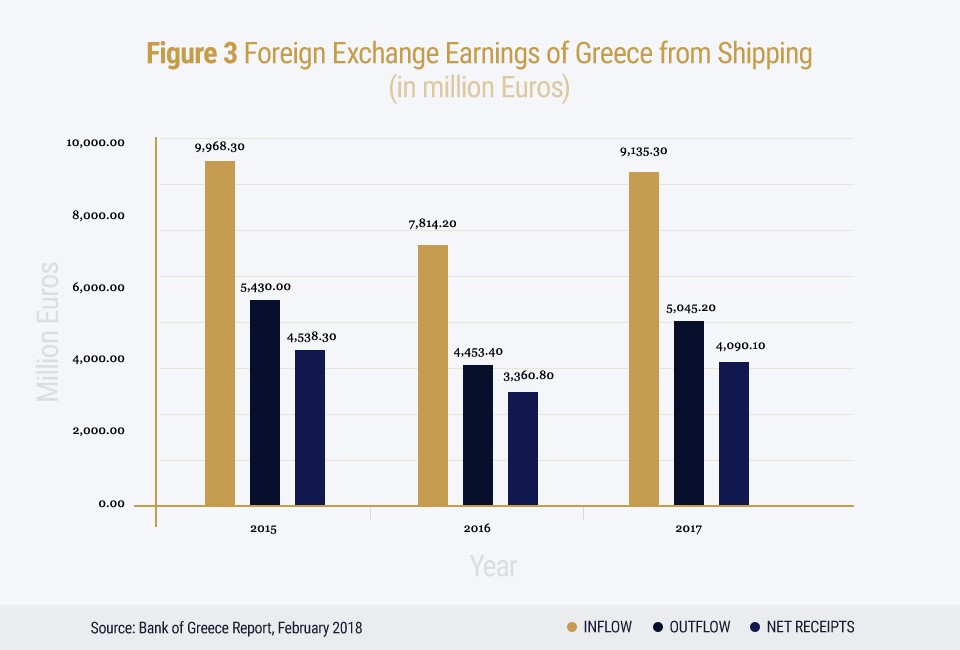
In 2017 the economic fundamentals of Greece hardly improved, while the relaxation of the restrictions on capital movements did not bring any significant change to the daily operations of the shipping industry, which remain heavily affected by the capital controls. In an economic environment nationally which unfortunately continues to offer little investment incentives, the Greek shipping sector provided increased foreign exchange earnings. In particular, the receipts in the Services Balance of Payments from maritime transport are estimated at approximately €9.14 billion for 20174. That is 16.91% more in relation to 2016 when the receipts were €7.81 billion (Figure 3).
The contribution of the Greek shipping to the country is multifaceted and not limited to the receipts in the Services Balance of Payments from maritime transport services. It ranges from indirect economic investments, to employment opportunities and to raising the profile of the country internationally by being a strategic trade partner of major economic and political forces, such as the European Union (EU) and the United States of America (USA). Greek shipping is a truly entrepreneurial sector, primarily comprising small and medium-sized private companies, mostly family businesses, which are involved mainly in bulk / tramp shipping. Due to its inherent features, Greek shipping maintains characteristics of perfect competition and exhibits great flexibility and adaptability in the ever changing world economic environment. The Greek fleet is highly responsive to shifts in trade patterns or the reorientation of trade flows and contributes to the building of new trading partnerships between suppliers and importers in a cost-effective way.
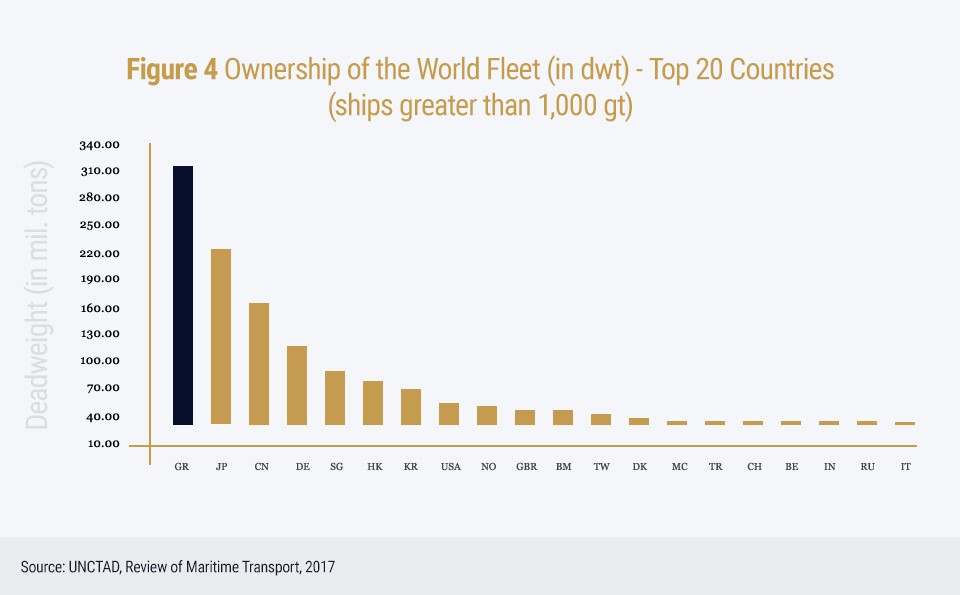
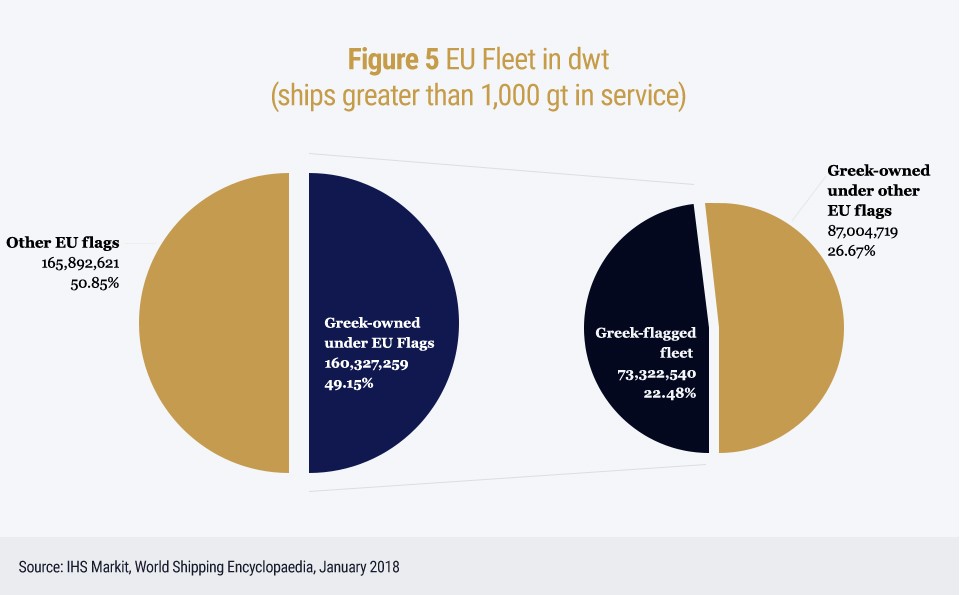
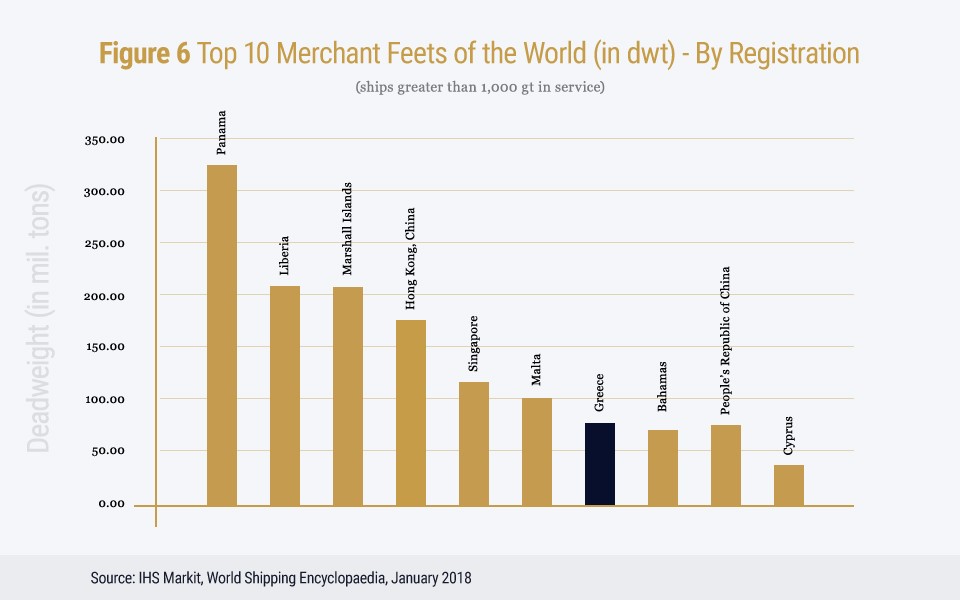
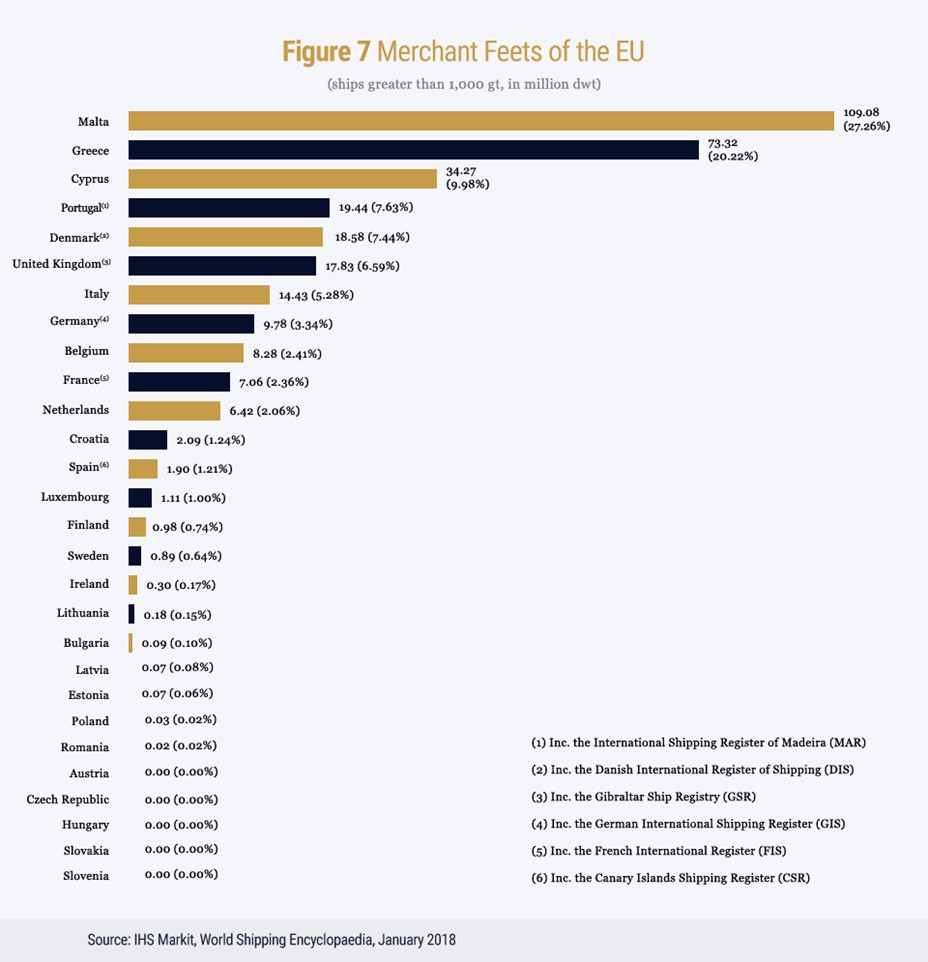
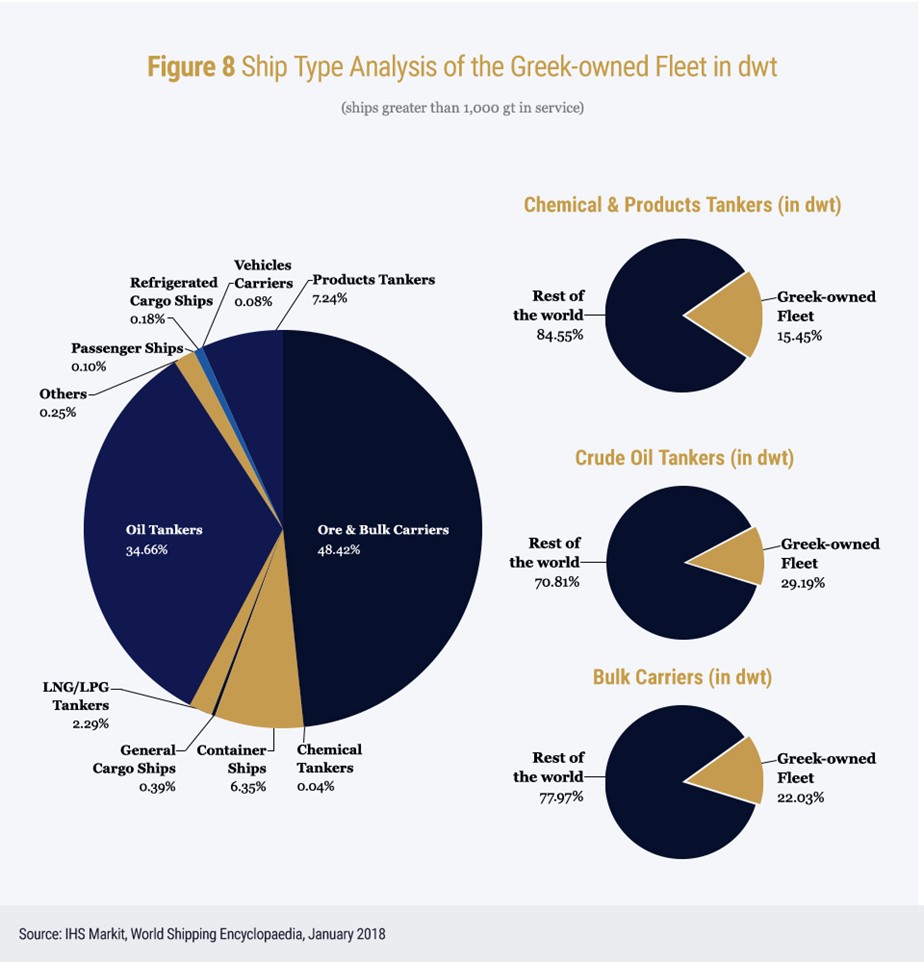
The numbers are indeed impressive; the Greek population represents only 0.15% of the world population but the ships that carry 20% of the global seaborne trade are controlled by Greeks. In particular, Greek shipping continues to hold the first position internationally (Figure 4). According to latest figures, the fleet amounts to 4,746 vessels (ships over 1,000 gt) of 365.45 million deadweight tons (dwt) – an increase of approximately 6.6% from the previous year – representing 19.89% of total world dwt and 49.15% of the total EU fleet5 (Figure 5). As such, Greek shipping plays an indispensable role in world seaborne trade including the EU’s export - import trade and in particular in securing the EU’s energy needs through the provision of reliable, efficient, green and safe sea transportation for the benefit of EU citizens and the EU economy at large. This state of affairs acquires additional importance in light of the fact that the EU relies on international shipping for more than 76% of its external trade6. The Greek Register accounts for 753 vessels (over 1,000 gt) amounting to 41.70 million gt7. The Greek-flagged fleet ranks seventh internationally (Figure 6) and second in the EU (in terms of dwt) (Figure 7). Moreover, Greek shipowners control 29.19% of the world crude oil tankers’ fleet, 22.03% of the world dry bulk carriers’ fleet and 15.45% of the world chemical and products tankers’ fleet (Figure 8).
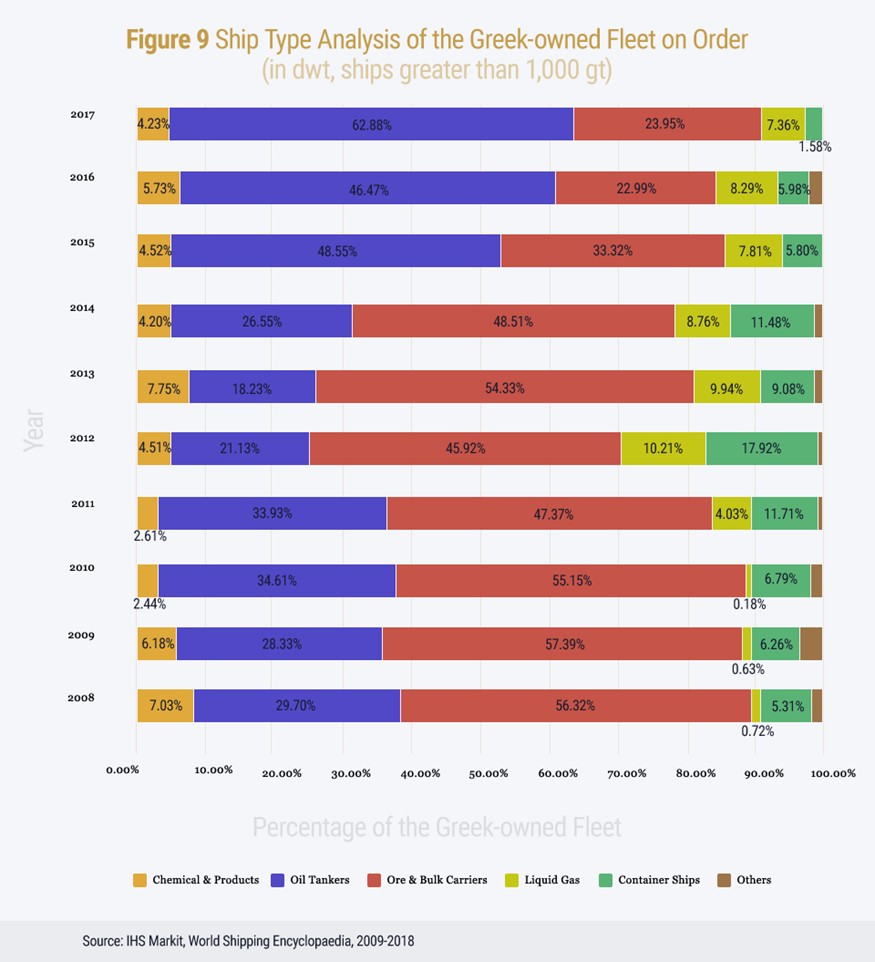
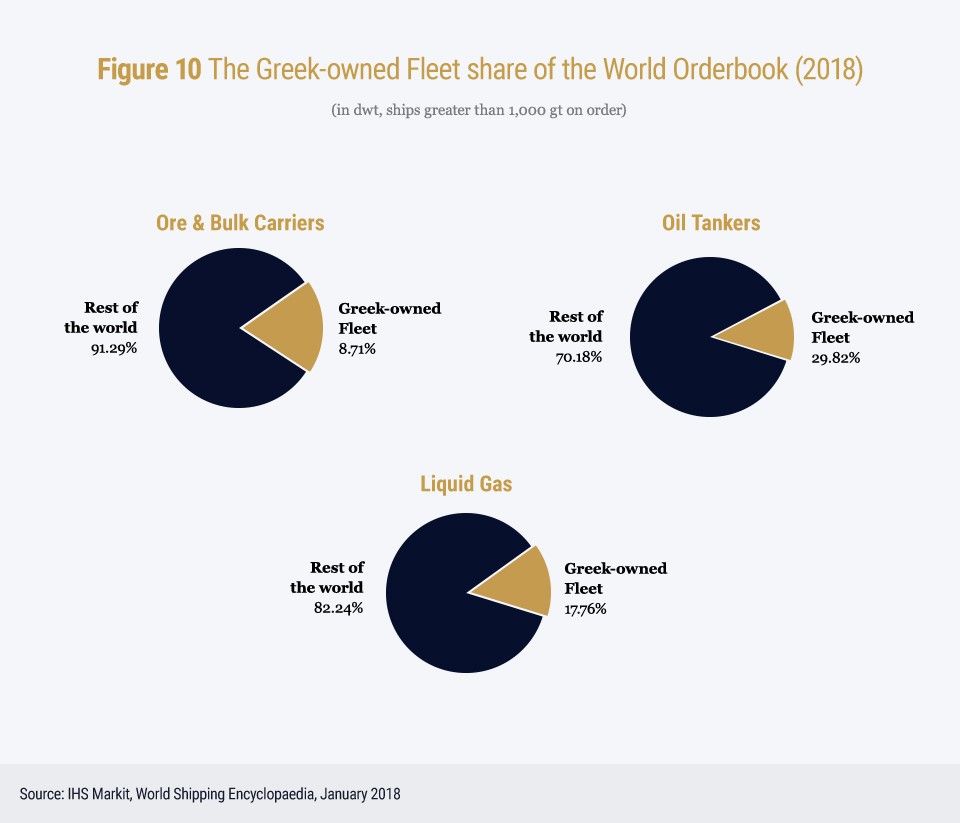
A further tightening of ship financing was observed in 2017, with European banks showing signs of stress. However, newbuilding orders by Greek interests amounted to 206 vessels (over 1,000 gt), representing 24.47 million dwt from a total of 2,333 orders of 175.30 million dwt8 by the end of 2017 (Figure 9). Of these vessels, 142 were tankers corresponding to 29.16% of world tonnage (dwt) on order, which include 33 LNG / LPG tankers amounting to 17.76% of world tonnage (dwt) on order, 58 dry bulk carriers corresponding to 8.71% of world tonnage (dwt) on order and 5 containerships corresponding to 1.38% of world tonnage (dwt) on order (Figure 10).
The age profile of the Greek-flagged fleet in 2017 was 13.7 years and that of the Greek-owned fleet 11.5 years, whilst the average age of the world fleet was 14.6 years9. Greece remains on the International Maritime Organization (IMO) “List of confirmed Standards of Training, Certification and Watchkeeping for Seafarers (STCW) Parties” and on the White Lists of the Paris and Tokyo Memorandum of Understanding, while it is one of the safest fleets worldwide with 0.65% of the fleet (based on number of ships) or 0.19% of the fleet (based on tonnage) involved in accidents10.
Going forward, the prospects for next year look relatively healthy with world output projected to grow at 3.9% in 201811. This increased growth is likely to emanate from improved global economic momentum both in advanced and developing economies, which are expected to benefit from favourable global financial conditions and strong sentiments and assist in the acceleration in demand and investment. However, the continued reorientation of the Chinese economy towards domestic demand, the trade and regulatory developments affecting shipping which are in a state of flux internationally and policy uncertainties, as in the USA and in the EU and the UK post-Brexit, constitute negative factors for world seaborne trade in the near future. Nevertheless, overall projections for world seaborne trade exhibit continued expansion, with volumes growing at an estimated annual growth rate of 3.2% until 2022 and cargo flows set to expand across all segments but faster in containerized and major dry bulk commodities trades12.
20% of global seaborne trade is carried in vessels controlled by Greeks who account for 0.15% of the world’s population. The Greek-owned fleet provides an indispensable service to our country, Europe and the world at large and constitutes a major achievement.